Energy Consumption and Carbon Footprint Spreadsheet
Created by CMIP IPO with Scribe
This spreadsheet is distributed to modelling centres participating in CMIP7 AFT and ongoing CMIP7 experiments.
Its purpose is to collect consistent information that enables the Task Team to:
- estimate energy consumption
- calculate the carbon footprint
- compare efficiency across platforms and experiments
Quick Start (Experienced Users)
If you already know the metrics:
- General Information tab
- Fill modelling group + contact details
-
Add HPC platform names
-
HPC centre information
-
For each machine: location, PUE, emission factor, energy mix %, source
-
Experiment Metrics tab
- Complete Tier 1 (required)
- Add Tier 2 (recommended)
-
Add Tier 3 (optional)
-
Add comments if needed
- Use Metrics short descriptions tab as glossary
For definitions or formulas → open the Guidelines (Zenodo link) at top of the sheet.
Step-by-Step Instructions
General Information Tab
Open the spreadsheet and locate key guidance links
Step 1 — Open the tab
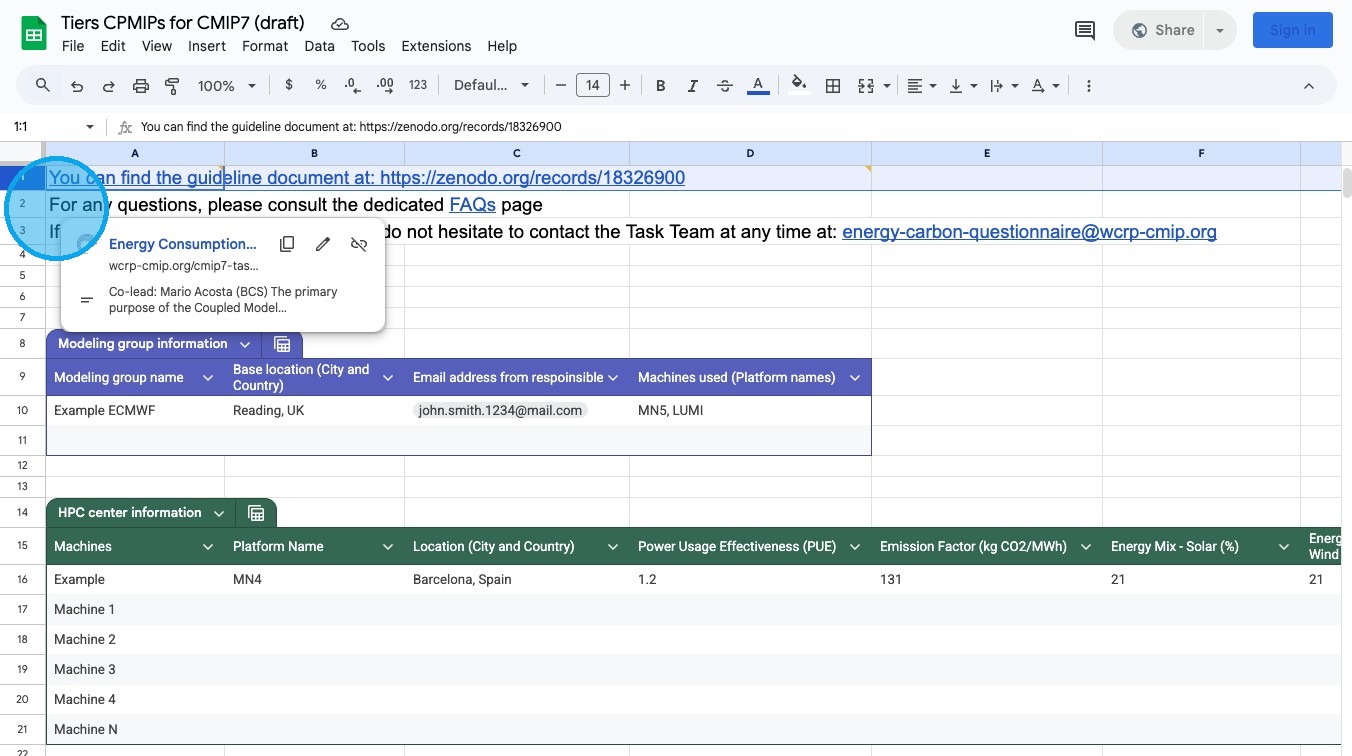
Step 2 — Guidelines document (Zenodo)
The Zenodo link provides: - Tier 1–3 metric definitions - calculation methods - PUE and emission factor explanations - best practices
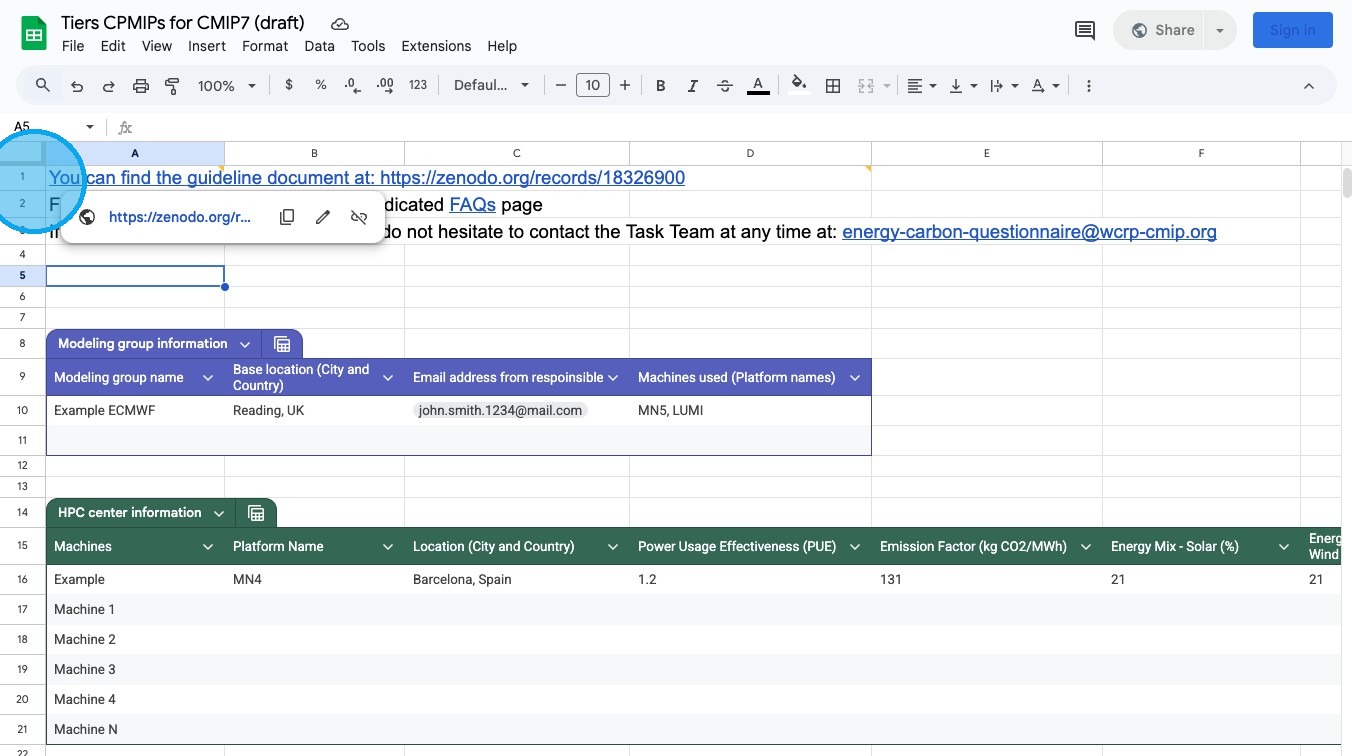
Step 3 — FAQ and contact
- FAQ link (updated over time)
- Task Team support email
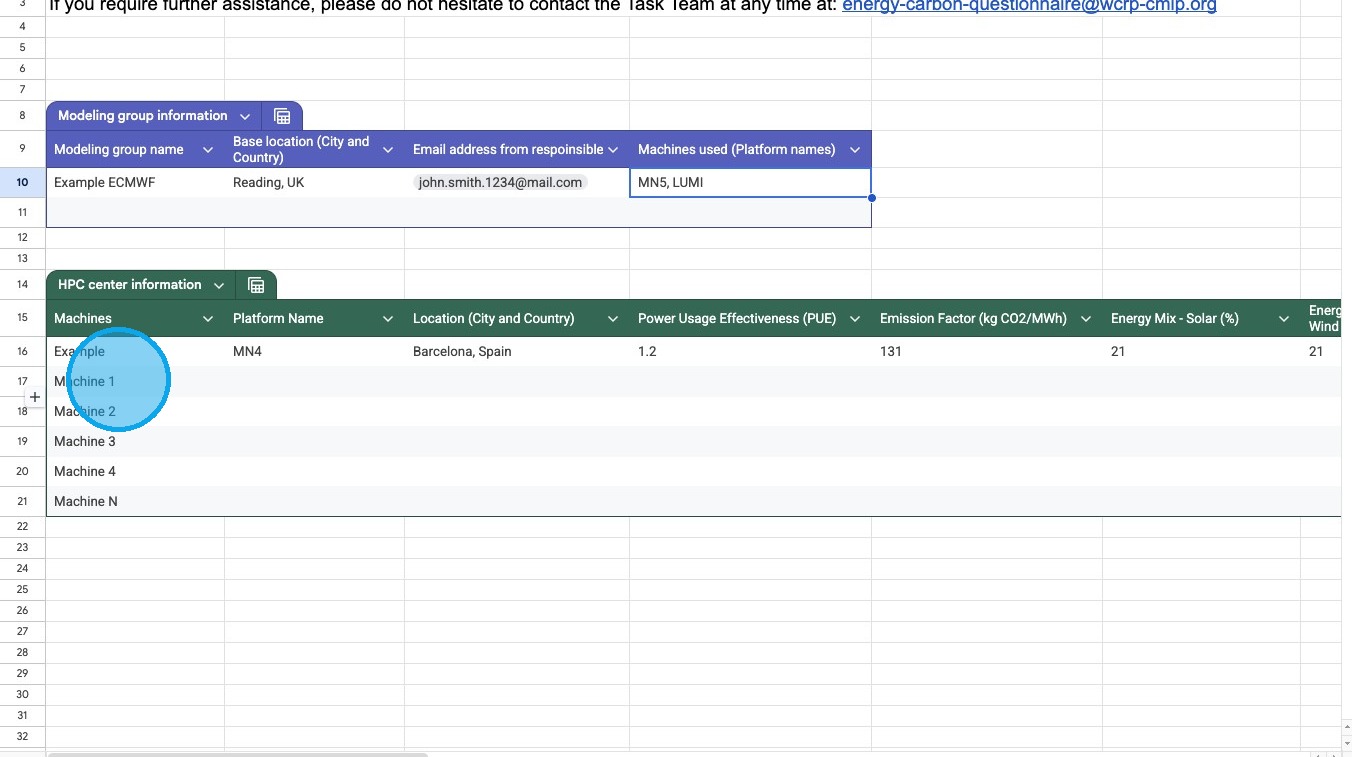
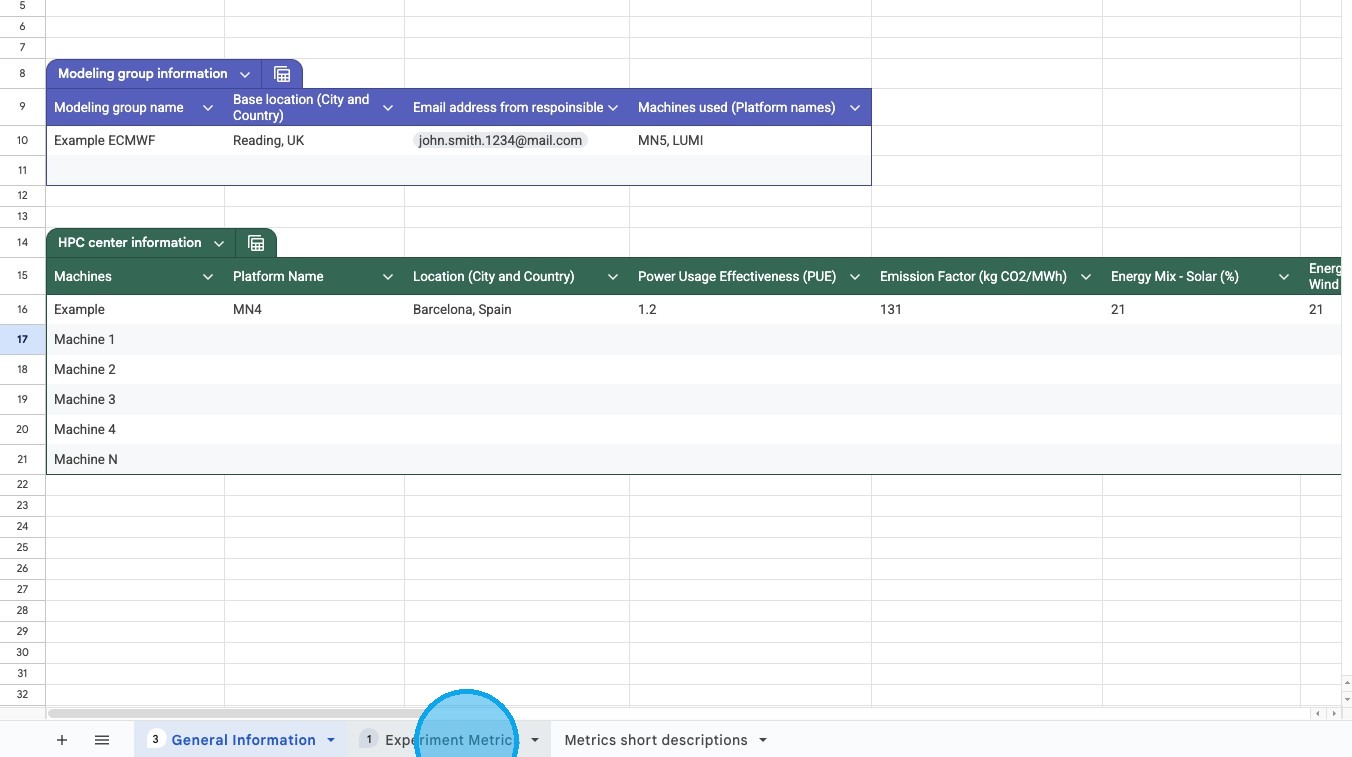
Modelling Group Information
Enter details about your centre
Fill in:
| Field | What to enter | Example |
|---|---|---|
| Modelling group name | Organisation or group | ECMWF |
| Location | City + country | Hamburg, Germany |
| Contact email | Person completing form | name@email |
| HPC platform name | Primary system name | Levante |
Screenshots
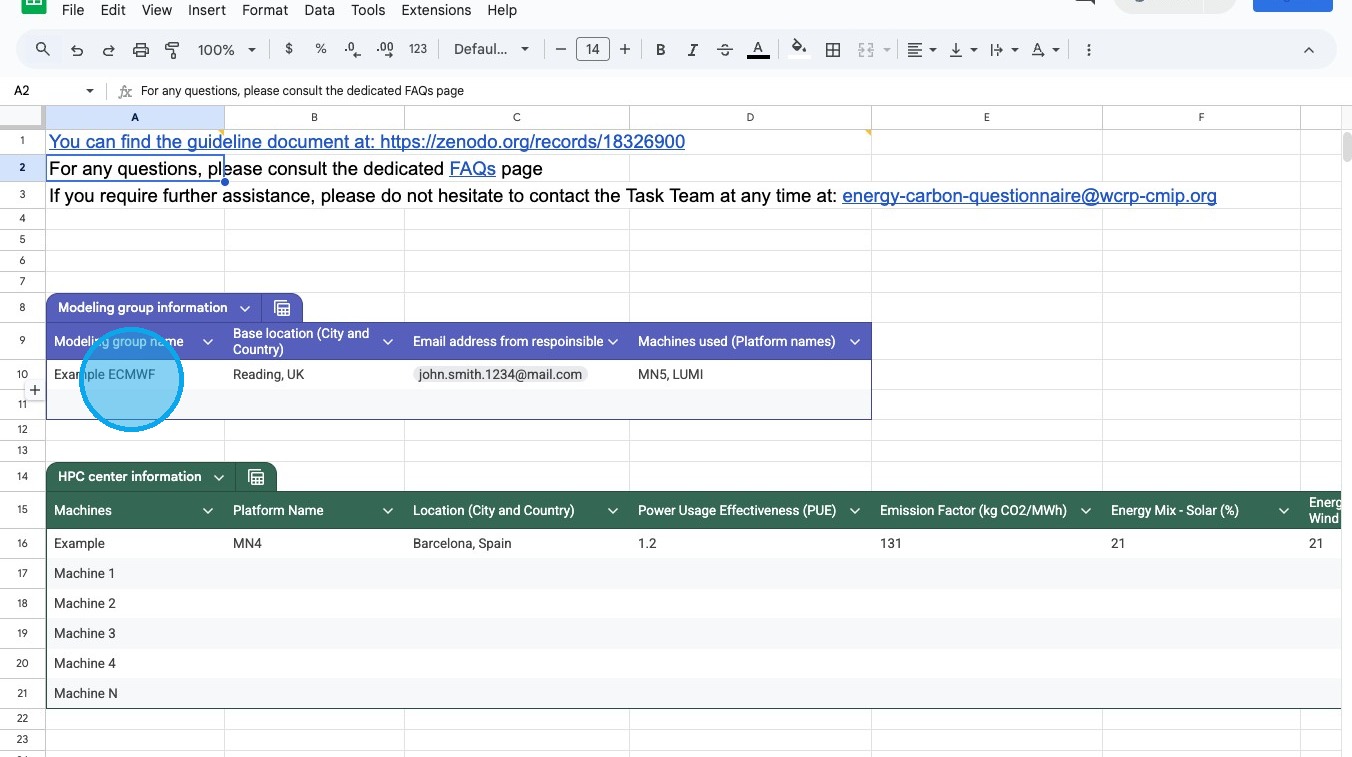


HPC Centre Information
Describe each HPC machine
Add one row per machine.
Required information:
| Field | Description |
|---|---|
| Platform name | Machine identifier |
| Location | City + country |
| PUE | Power Usage Effectiveness |
| Emission factor | Carbon intensity of electricity |
| Energy mix (%) | Source breakdown |
| Source | Link or text reference |
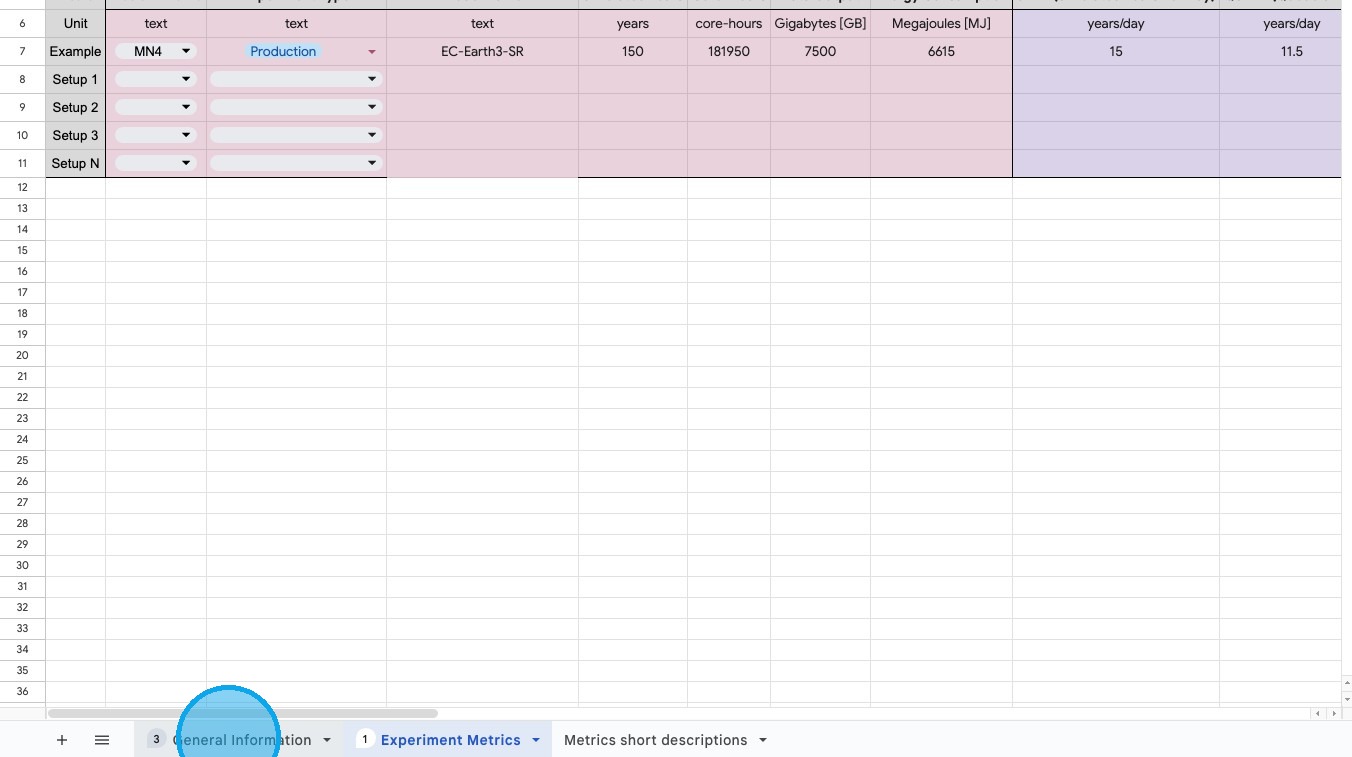
Experiment Metrics Tab
Select Experiment Metrics.
Tier 1 — Strongly Recommended (Minimum Required)
Core inputs required to compute carbon footprint
A Setup = experiments of same type, same mode, same machine.
Enter for each setup:
| Field | Example |
|---|---|
| Platform name | dropdown |
| Experiment type | Production / Tuning / Discarded |
| Model name | ICON |
| Simulated years | 100 |
| Core hours | 13000 |
| Data output (GB) | 4000 |
| Energy consumption (MJ) | calculated |
Tier 2 — Recommended
Performance and efficiency metrics
| Metric | Example |
|---|---|
| SYPD | 12 |
| QSYPD | 10.5 |
| RSYPD | 9.5 |
| Parallelisation (cores) | 500 |
| Data output intensity (GB/core-hour) | 0.05 |
| Number of grid points | 1.5E+06 |
Provides deeper insight into performance and resource use.
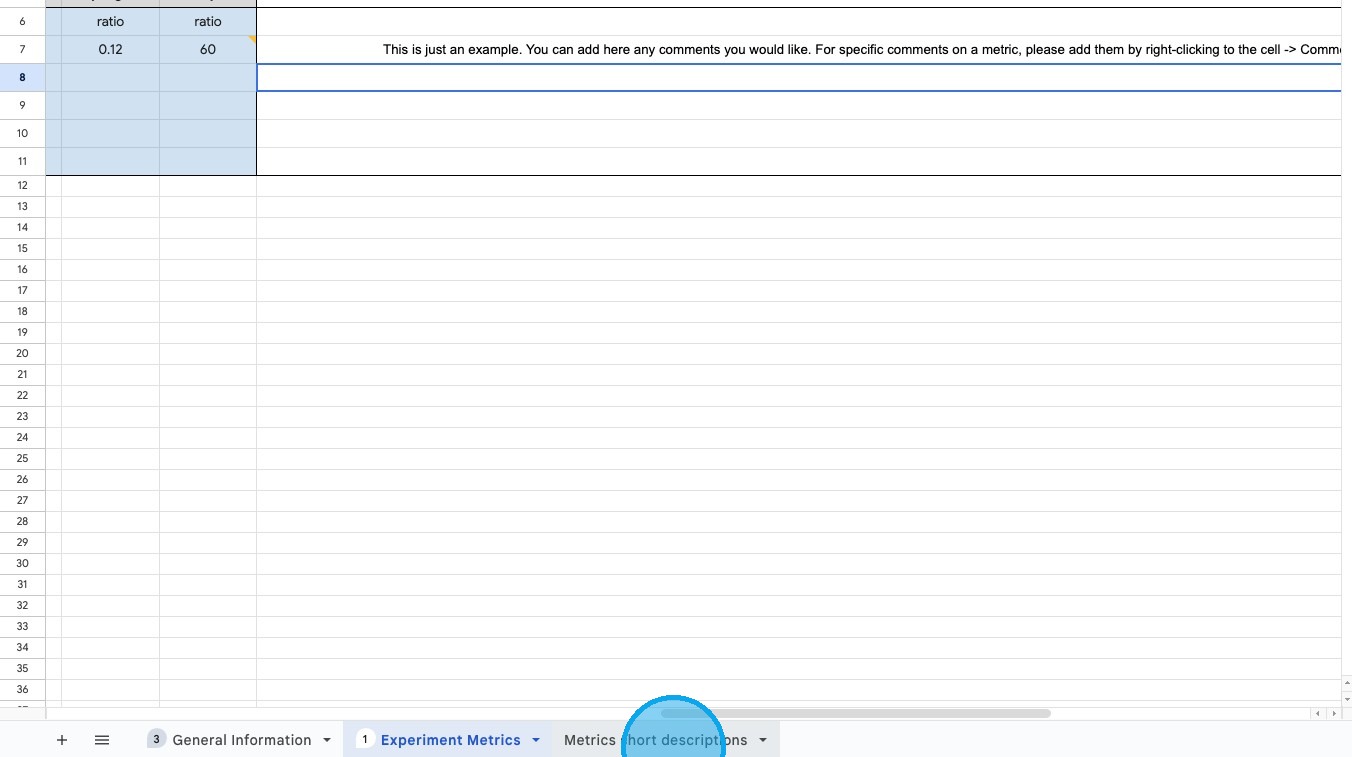
Tier 3 — Optional
Advanced/diagnostic metrics
| Metric | Example |
|---|---|
| Complexity | 32 |
| Data output cost | 0.12 |
| Coupling cost | 0.12 |
| Memory bloat | 50 |
Complete only if data is available.
Comments
Add any notes or explanations related to: - assumptions - estimates - missing values - special configurations

Metrics Glossary
Open Metrics short descriptions for definitions of all fields.
For detailed explanations or formulas, return to the Guidelines document in the General Information tab.